Class Warfare
Calls to Cut Taxes Help the MOST RICH, Not You!
Our middle class is collapsing. For over 30 years America's MOST RICH have been waging war against the middle class and poor. They have hidden their secret agenda in a fancy term called Supply Side economics. Our rich have argued that if we reduce their taxes, lower government regulation and increase privatization that ALL Americans would prosper.
 Warren Buffett claims this economic argument is a fraud. "The rich are always going to say that, you know, just give us more money and we'll all go out and spend more, and then it will trickle down to the rest of you," he told Christiane Amanpour on This Week. "But that has not worked the last 10 years, and I hope the American public is catching on."
The Tax Foundation reported in July 2009 that between 2000 and 2007, pre-tax income for the top 1 percent of tax returns grew by 50 percent, while pre-tax income for the bottom 50 percent increased by 29 percent (not adjusted for inflation) ...
Since 2001, the average tax rate has fallen from 4.09 percent to 2.99 percent for the bottom 50 percent of tax returns and has fallen from 28.20 percent to 21.46 percent for the top 0.1 percent and 27.5 percent to 22.45 percent for the top 1 percent. TaxFoundation
I ask you: are you prospering?
Groups like the Tax Foundation will tell you the tax burden of the Top 1% now exceeds the taxes paid by the remaining 95% of filers. This is correct. America's MOST RICH are paying more ... yet I show conclusively that the MOST RICH are paying more in total taxes because they have become increasingly wealthy and are hogging more and more of the American economic pie. Contrary to their claims, America's MOST RICH are paying relatively less tax than three decades ago and ensuring the financial devastation of you and your family.
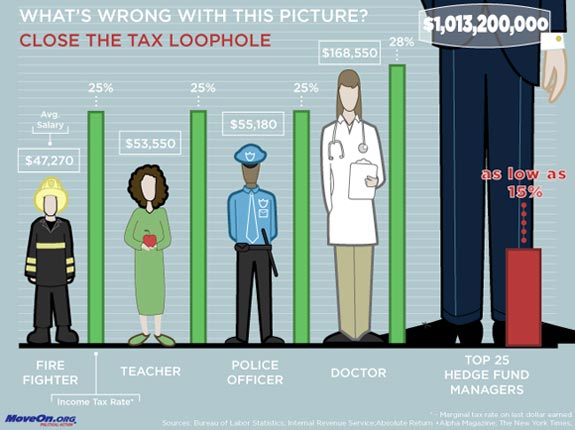
Warren Buffett, who is the world's second richest man and leading American entrepreneur, testified he paid a 16.5 percent federal tax rate on his billions while middle class workers at his company paid 25 percent. I include an illustration below from MoveOn.org that highlights Warren's point: tax loopholes and laws allow millionaires to pay as little as 15 percent while middle class workers pay 25 - 28 percent. Mr. Buffett added recently:
There's class warfare, all right, but it's my class, the rich class, that's making war and we're winning.
Updated Income Figures
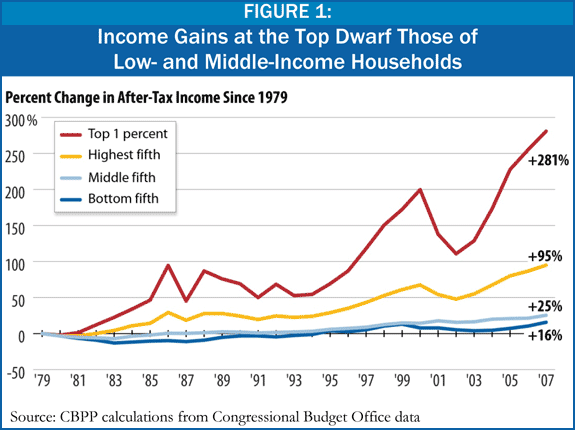
In the income/tax analysis used later in this article, I relied on the latest published information, which was 2005 data. The Center on Budget and Policy Priorities released more recent information in June 2010 using 2007 figures. Figure 1, below, highlights income gains for the Top 1%, Highest Fifth (Top 20%), Middle Fifth and Bottom Fifth. Income gains by the MOST RICH and Top 20% dwarfed the rest of the population. source
CONTINUALLY UPDATED NEWS SECTION
Who's buying homes? The rich
[3.7.11] The rich are different from you and me: They're buying real estate. "It hasn't been a good six months for all people, but it was a good six months for rich people," said Glenn Kelman, CEO of Seattle-based real estate brokerage Redfin.
"When Wall Street goes up, rich people buy homes." And Wall Street has gone up: Stock values have nearly doubled from their March 2009 lows. "Higher income households are feeling better about their financial security," said Greg McBride, chief economist for Bankrate.com. As their confidence soared, the wealthy took advantage of bargains in expensive homes. CNN Money
Rebound of the Rich: Wealth Rises to $39 Trillion
[6.23.10] Great Recession? What recession? The world’s millionaires and billionaires - now totaling 10 million - saw their overall wealth jump 18.9% last year, to $39 trillion ... people with at least $1 million in assets beyond their homes and household goods climbed 17%; the very rich - those with disposable assets exceeding $30 million - did even better, increasing their wealth by 21.5%.
At the end of 2009, "ultra-high net worth individuals" held 35.5% of the total $39 trillion of the world's wealth, or an estimated $13.8 trillion, even though this group represented less than 1% of the 10 million people classified as being rich (or roughly 90,000 worldwide). NY Times
Taxes at Lowest Level in 60 Years
[5.10.10] Amid complaints about high taxes and calls for a smaller government, Americans paid their lowest level of taxes last year since Harry Truman's presidency, a USA TODAY analysis of federal data found.
Federal, state and local taxes - including income, property, sales and other taxes - consumed 9.2% of all personal income in 2009, the lowest rate since 1950, the Bureau of Economic Analysis reports. That rate is far below the historic average of 12% for the last half-century. The overall tax burden hit bottom in December at 8.8.% of income before rising slightly in the first three months of 2010. USAToday
Goodbye, stimulus. Hello, state budget cuts
Businesses Refuse to Hire; Consumer Demand Remains Weak
Egregious Tax Loophole
[6.15.10] The NY Times reports on "an egregious tax loophole that allows wealthy fund managers at private equity firms and other investment partnerships to pay a top tax rate of just 15 percent on much of their earnings - versus a top rate of 35 percent for all other higher-income Americans. Closing the loophole would raise an estimated $25 billion over 10 years." NY Times
The Injustice Continues: We Ask Only For Tax Fairness
[2.24.10] Wall Street Bonuses Soar 17%; Compensation jumps 31% at Goldman Sacks, Morgan Stanley and JPMorgan - averaging $340,000 per employee. And, these companies and workers claim they shouldn't pay more taxes, while your tax rate is dragging you under and our national debt is exploding. LA Times
[1.26.10] Has the tide turned toward the middle class on Main Street? Oregon ended its history of shooting down tax increases on statewide ballots, as voters endorsed higher taxes on businesses and the rich during our brutal recession ... The increases approved Tuesday ask people with taxable income upward of $125,000 to do more - fewer than 3 percent of filers. Businesses paying an annual $10 minimum will see this rise to at least $150. Washington Post
[1.24.10] A new analysis of state wages shows the gulf between Oregon's wealthy and everyone else continues to widen. Oregon's wealthiest are not only earning more, but the rate at which their incomes are growing far outstrips the middle class and the poor.
Conservatives generally dismiss concerns about income inequality as "class warfare." They claim economic growth benefits rich and poor alike. But our trickle-down economy has sent just that - a trickle - to the masses, while steering a torrent of riches to the wealthy.
"There's something going on at the very top, an explosion of the 'uber-rich,'" said Bryce Ward, a senior economist with Portland-based consulting firm ECONorthwest. "There's been no growth in a decade for the middle." Oregon Live
[1.10.10] While you are suffering pay cuts or forced to stand in longer lines to receive public services because of cuts, the RICH continue to steal from you. Goldman Sachs is expected to pay its employees an average of about $595,000 apiece for 2009, one of the most profitable years in its 141-year history (thanks to your tax dollar support). Workers in the investment bank of JPMorgan Chase stand to collect about $463,000 on average. NY Times
Background and History
Our national debt exploded during the eight years of the GW Bush administration - increasing from some $5 TRILLION to over $11 TRILLION. This was intentional. Conservatives want to derail FDR New Deal programs, such as Social Security and Medicare. They believe in using tax dollars to go to war but not to help middle class families. They allowed our national debt to explode; locked us into two wars; and conveniently, the economy crashed. Can you believe this scenario makes them happy?The Obama administration has been forced to increase the deficit another trillion or so to combat the financial collapse on Wall Street. "We The People" currently owe over $12 TRILLION. Now conservatives claim they are "deficit hawks" and demand public services be cut. This further hurts middle class working families while our MOST RICH are wealthier than ever.
In 2007 the TOP .01% of American earners took home 6 percent of total U.S. wages, a figure that has nearly doubled since 2000; the TOP 10% grabbed 49.7 percent of total wages - higher than any other year since 1917 and even surpasses 1928, the peak of stock market bubble in the Roaring 1920s. source
As there are many ways to analyze Distribution of Income in America I've used the methodology from the U.S. Congressional Budget Office (CBO). They divide society into FIVE parts: Lowest Quintile (1-20%); Second Quintile (21-40%); Middle Quintile (41-60%); Fourth Quintile (61-80%); and Highest Quintile (81-100%). The CBO further subdivides the Highest Quintile into three subgroups: Top 10%, Top 5% and Top 1%. source
For simplicity I have focused on the three top Quintiles. Keep in mind that the bottom two groups of Americans are hurting very badly. Some 50 million people do not have access to health insurance. Many are food insecure - unsure whether they will eat today or not.
Average Income Compared Over Time
In 1979 Americans in the top Quintile made $132,100 per year on average. This was nearly twice as much (92.4% higher) than the fourth Quintile ($69,000). Average income of the rich was 159 percent higher than average middle Quintile income ($132,100 v. $51,000). See the chart below.
Beginning in the 1980s these relationships changed drastically. Income over the next 26 years exploded for the MOST RICH. Their average income increased 75.1 pecent to $231,300 from $132,100 - an average of 2.9 percent per year. Income for those in the fourth Quartile grew less rapidly. Over the period their income increased 23.5 percent to $85,200 from $69,000 or 0.9 percent per year on average.
The Middle Quartile has suffered most greatly. Over the 26 year period their average income has increased ONLY 14.7 percent or 0.6 percent per year on average, to $58,500 from $51,000.
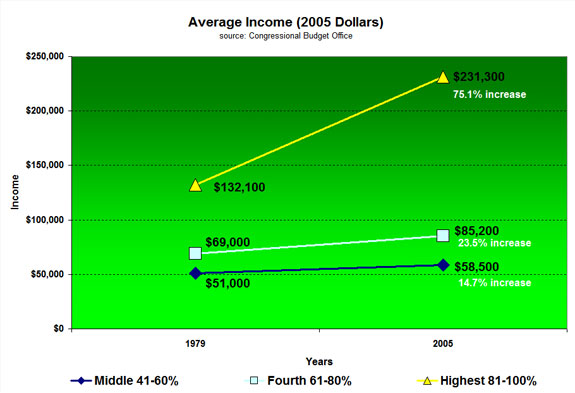
Congressional Budget Office, Appendix_wtoc.pdf, Table 1C, page 8
Average Income of our MOST RICH Compared Over Time
Looking at the Highest Quintile - or top 20 percent - more closely. The CBO details average income figures for the Top 10%, Top 5% and Top 1%. The outrageous transfer of wealth is even more apparent when looking at our MOST RICH. See the chart below.
The Top 1% made 10 TIMES the average income of Middle Quintile earners in 1976. By 2005 this disparity had increased to 26 TIMES: $1,558,500 v. $58,500. As most of us are aware this is ridiculous and the massive income inequality is crushing middle class families.
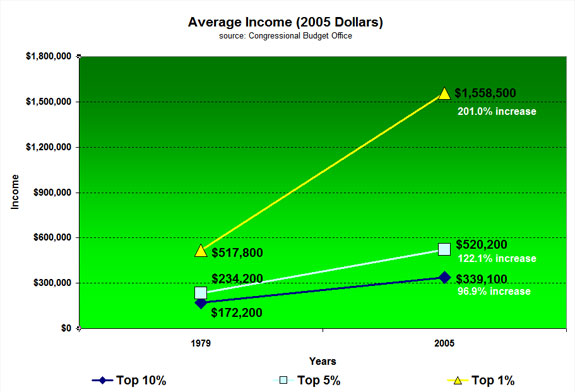
Congressional Budget Office, Appendix_wtoc.pdf, Table 1C, page 8
After-Tax Income by Income Group: 1979-2005
Comparing After-Tax Income for the eight groups paints an even more distressing picture. The Bottom 20%, our nation's poorest segment of society, made on average $10,800 in 1979. By 2005 their average income had grown to $11,100, which is increase of only $300 in 26 years. This translates into a raise of less than $12 per year - less than one dollar per month - on average over the period (see the table below).
These figures are not adjusted for inflation, which runs about 3 percent per year on average. Thus the Bottom 20%, 2nd Quintile, 3rd Quintile and 4th Quintile lost financial ground over the last three decades. Food, energy and medical costs have increased at a much faster rate than the general rate of inflation and explains why so many Americans are slipping into financial ruin.
On the other hand, as we examine America's most fortunate members, Top 20%, Top 10%, Top 5% and Top 1%, we see where income growth has occurred. The nation's most wealthy, Top 1%, realized a growth rate of 8.2 percent per year on average - more than tripling their take-home income - over the period.
| GROUP | 1979 | 2005 | $ Chg/Yr | % Chg/Yr |
| Bottom 20% | $10,800 | $11,100 | $12 | 0.1% |
| 2nd Quintile | $22,700 | $27,200 | $175 | 0.8% |
| Mid Quintile | $32,700 | $41,100 | $325 | 1.0% |
| 4th Quintile | $45,100 | $60,300 | $585 | 1.3% |
| TOP 20% | $83,400 | $148,000 | $2,500 | 3.0% |
| TOP 10% | $104,500 | $209,200 | $4,026 | 4.9% |
| TOP 5% | $139,00 | $314,800 | $6,762 | 4.9% |
| TOP 1% | $304,800 | $951,800 | $24,885 | 8.2% |
Congressional Budget Office, Appendix_wtoc.pdf, Table 4C, page 41
State and Local Tax Rates Compared
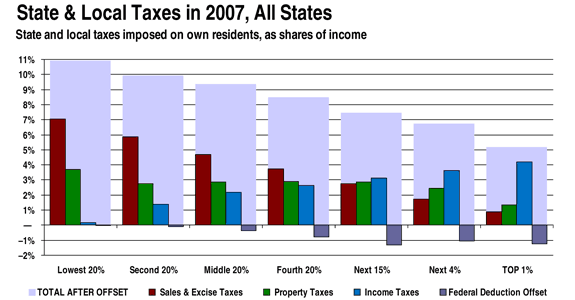
A study released by the Institute on Taxation and Economic Policy adds to Buffett's remarks. Their research found "nearly every state and local tax system takes a much greater share of income from middle- and low-income families than from the wealthy."
America's TOP 1% now pay 6.4 percent of their income in state and local taxes on average. They actually pay less - since they can deduct their state and local taxes from their federal tax bill. State and local tax burden on America's rich, after taking this offset into account, drops to 5.2 percent.
Middle-income families pay 9.4 percent of their income in total state and local taxes after the federal offset. Our poorest families pay even more. Tax collectors take 10.9 percent from our nation's BOTTOM 20%, more than double the share they take from the nation's TOP 1%. source
These findings are further supported by a study from the Institute on Taxation & Economic Policy, Who Pays? A Distributional Analysis of the Tax Systems in All 50 States. As the graphic below shows, state and local taxes are highly regressive - nearly every state and local tax system takes a much greater share of income from middle- and low-income families than from the wealthy. source
The "Rich" Say They Pay More
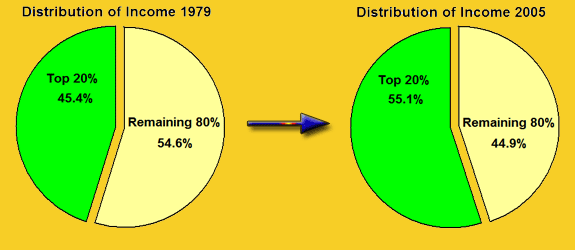
This is a claim that receives a great deal of SPIN in political discussions. Examiming federal Pretax Share of Income, our MOST RICH have done well for themselves over the past 30 years. In 1979 the TOP 20% garnered 45.4 percent of all wealth. By 2005 this percentage had INCREASED to 55.1 percent.
Pre-Tax Total Wealth Held by MOST RICH
| Top 10% | Top 5% | Top 1% | |
| 1979 | 30.5% | 20.7% | 9.3% |
| 2005 | 40.9% | 31.1% | 18.1% |
Congressional Budget Office, Appendix_wtoc.pdf, Table 1C, page 9
Federal After-tax Share of Income figures are similar. In 1979 the TOP 20% took home 42.4 percent of all wealth. By 2005 this amount had increased to 51.6 percent. In other words 20 percent of our population now controls over 50 percent of all wealth after paying federal taxes.
After-Tax Total Wealth Held by MOST RICH
| Top 10% | Top 5% | Top 1% | |
| 1979 | 27.6% | 18.1% | 7.5% |
| 2005 | 37.4% | 27.8% | 15.6% |
Congressional Budget Office, Appendix_wtoc.pdf, Table 1C, page 10
Examining the ratio of pre- to after-tax income for the period we can resolve the question whether the TOP 20% actually pay more taxes today.
Pre-Tax Income Compared to After-Tax Income: 1979-2005
| % Total Pre-Tax '79 Income | 45.4 | % Total Pre-Tax '05 Income | 55.1 |
| % Total After-Tax '79 Income | 42.4 | % Total After-Tax '05 Income | 51.6 |
| % Tax 1979 | 6.61 | % Tax 2005 | 6.35 |
The TOP 20% pay less by percent today. They do pay MORE taxes - due simply to the fact they are making so much more. Roughly they have increased their total wealth by about 83 percent while they pay about 60 percent more in taxes.
Keep in mind most of our elected officials fall into the TOP 20% group. They have an active interest in keeping THEIR taxes low and INCREASING their wealth - at YOUR expense. They clearly do not represent YOU or ME. America's RICH are taking more than their fair share from our system, which is collapsing your family and our nation.
As Warren Buffett warns, "There's class warfare, all right, but it's my class, the rich class, that's making war and we're winning."


