Uneven Income Growth Threatens America
Our parents failed us ... left us with Global Pollution and a collapsing USA job market: Fifty years ago, when General Motors was the largest employer in America, the typical GM worker got paid $35/hour in today's dollars. Today, America's largest employer is Walmart and the typical Walmart worker earns about $8.80/hour.
The United States has higher degrees of poverty and inequality than most other Western industrialized nations. The United States also has more modest retirement benefits and larger burdens from out-of-pocket health costs than most other Western nations.
Data from the IRS show the tax bite on very highest income taxpayers has fallen as their incomes have risen. In 2007, the top 400 individual tax returns had an average adjusted gross income of $345 million, up from $47 million in 1992. But their average tax rate was just 17 percent, down from 26 percent in 1992.
source: Center on Budget and Policy
The Role of Organized Labor
Timothy Noah, writes in his book, The Great Divergence: America's Growing Inequality Crisis And What We Can Do About It (Bloomsbury), from the early 1930s through the late 1970s incomes in the United States either grew more equal or remained relatively stable in their distribution. Then, starting in 1979, incomes grew more unequal. Middle class incomes stagnated relative to their growth in the postwar era and also relative to productivity (i.e., output per man- or woman-hours worked), which had dwindled during the 1970s but grew starting in the 1980s and took off like a rocket in the aughts. See illustration from TPM — Talking Points Memo — below:
Meanwhile, incomes for the affluent, which had grown at about the same rate during the postwar years as incomes for the middle class, started growing much faster, and incomes for the super-rich started growing much, much faster. (Incomes for the poor actually came up slightly over this 33-year period, but dropped precipitously when the recession hit.)
Why? One reason: organized labor is on the ropes.
In a July 2011 newsletter for Morgan clients, Michael Cembalest wrote, "U.S. labor compensation is now at a 50-year low relative to both company sales and U.S. GDP." From 2000 to 2007, Cembalest calculated, pretax profits for the Standard & Poor's 500 increased by 1.3 percent. Reductions in wages and benefits accounted for about 75 percent of that increase. [5]
How America's Middle Class Became The Underclass
It all began with Ronald Reagan and "Reaganomics," a.k.a. Supply Side Economics, Trickle Down Theory or as George HW Bush liked to refer to as, "Voodoo Economics." Remember??? We were promised that if we put more money in the hands of the Rich, they would create more and better paying jobs. Today, we know this isn't simply false ... it has been a criminal deception, as millions and millions of hard working, Middle Class families cannot make ends meet. Wealth indeed is "trickling down" as families are collapsing.
The average American's income has not changed much, while the Richest 5% (above) and Richest 10% (below) of Americans have seen their earnings surge. This chart includes capital gains.
source: CNN
I quote from Warren Buffett, world's second richest man and leading American entrepreneur, who testifies:
"There's class warfare, all right, but it's my class, the rich class, that's making war and we're winning."
The chart below highlights the EXPLOSION in corporate after tax profits. Companies like G.E. realized PROFIT in excess of $14 billion in 2010, yet paid no federal income tax. They don't pay, so you must!
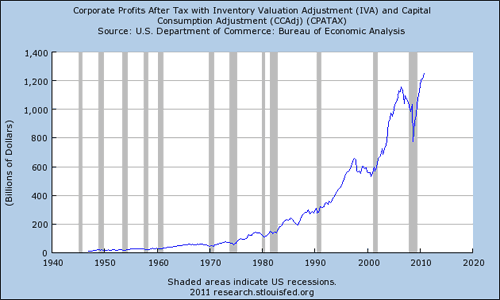
source: Fortune
You're Getting Creamed!
Hey you! Yes, you, the American worker, you are getting creamed. You have been losing for years! Jesse Drucker, writing in the Wall Street Journal, pointed out America's rich are only getting richer (see Drucker's chart below):
In a new sign of increasing inequality in the U.S., the richest ONE percent of Americans in 2006 garnered the highest share of the nation's adjusted gross income for two decades, and possibly the highest since 1929, according to Internal Revenue Service data.
At the same time, the tax rate of the wealthiest ONE percent fell to its lowest level in a least 18 years. The average tax rate in 2006 for the top ONE percent, based on adjusted gross income, was 22.8 percent, down slightly from 2005 and the fifth straight year of declines. The average tax rate of this group was 28.9 percent in 1996, and was 24 percent in 1988. [1]
America's Rich Grow Richer, 1986-2006
Are you pissed off enough to wake up from this economic nightmare? I know you're screaming about high gas prices and soaring costs for food. You're mad as hell that your home value has dropped precipitously. People on the political right, Republicans, demand "market economics" when times are good. Yet you, the taxpayer, are currently bailing out Wall Street financial and mortgage companies. You don't share in their profits, but you help pay for their losses. You are getting creamed!
Income Inequality in the United States, 1970-1998
Income Inequality
The chart above compares CEO Pay to the Average Wages of Workers between 1970�1999 [2]. While management compensation is exploding, worker pay is barely rising (but you already knew that, didn't you?).
You're working harder than ever. You're actually more productive than ever as well.
Since 1979, hourly earnings for 80 percent of American workers (those in private-sector, nonsupervisory jobs) have risen by just ONE percent, after inflation. The average hourly wage was $17.71 at the end of 2007.
Worker productivity, meanwhile, has climbed 60 percent. If wages had kept pace with productivity, the average full-time worker would be earning $58,000 a year. $36,000 was the average in 2007. [3]
You're working more; you're doing more per hour; so where's the extra money going? Yep! That extra profit is going straight into the pocket of the CEO and upper management. You're getting creamed financially.
Real Annual Income Growth by Groups, 1993-2006
Real Income Growth
America has been a great place to live and work due in part to our robust Middle Class. Workers and management have shared in the profits of our labor and their leadership. It is a delicate system where we share the winnings. Yet in recent years, we have lost the balance that helped build this great nation. The chart above highlights Real Annual Income Growth between 1993-2006. [4] This covers both the Bill Clinton and George W. Bush presidencies. Under Clinton, incomes for the TOP ONE percent of wage earners grew nicely at 10.3 percent per year (column 2). For the rest of us, the remaining 99 percent, we saw our incomes rise at about 2.7 percent per year (column 3).
This changed dramatically during the GW Bush administration. The TOP ONE percent of wage earners grew dramatically by 10.9 percent per year -- at the expense of the bottom 99 percent. Our income grew by only ONE percent per year.
Column 4 captures the distribution of this newly created wealth. Under Clinton, increased profits were shared in a more balanced fashion, as 45 percent of profits went to the TOP ONE percent and the remaining went to the rest of us. Under GW Bush, the TOP ONE percent captured nearly $0.75 of every growth dollar (73%).
Under Clinton, the rich prospered handsomely; under GW Bush it has been robbery.
You are getting creamed, yet you do nothing!
[1] Richest Americans See Their Income Share Grow, Wall Street Journal Online
[2] Forbes Annual Compensation surveys of CEOs in top 800 companies; Average wages of full-time employees are from National Income Accounts, as referenced in THE QUARTERLY JOURNAL OF ECONOMICS, Vol. CXVIII, February 2003, Issue 1, (see p.33)
[3] Greenhouse, Steven, THE BIG SQUEEZE: TOUGH TIMES FOR THE AMERICAN WORKER, 2008, (see p.5)
[4] Piketty, Thomas and Emmanuel Saez (2003), series updated to 2006 in July 2008 using final IRS tax statistics, (see Table 1)
[5] Noah, Timothy, "Why Edward Conard Is Wrong About Income Inequality," Huffington Post, May 29, 2012.
Highlights


Features
EXTERNAL
First Hawaiian Cheats
Hawaiian Electric & HECOgate
HoopCamp
Hula Just For You
InfoImagination
Medicare 4 Anybody
SAVE Memorial Day
Waikiki Wizard Speaks
TOPICS
Class Warfare
Danger on Kaua'i
Honoring Bob Goold
Income Inequality
Insane Cannabis Policy
Iran & ISIS Clarified
Israel: Please Stop
March Madness and Love
Media Manipulation
Political Issues
Stoked on Surfing
Symptoms of Inner Peace
Theft of Hawai'i
Tribute to Cary Colaianni
Trump Report on Jan 6th

Dividing Those Who Love the Islands

Next Surf Safari